You can now ask about BigQuery data in plain language with Gemini in Google Sheets. Announced by Google on October 19, 2026, this feature has Gemini take questions about data attached through Connected Sheets (a connector for working with BigQuery data directly in Google Sheets) and answer based on the full BigQuery data, not just the portion visible in the sheet. You can keep asking follow-up questions, or describe the report you want and it will even build a dashboard tab with refreshable formulas, pivot tables, and charts.
"Can I see last month's revenue by channel compared to the same month last year?" At companies where data lives in BigQuery, even a single question like this often means filing a request with the data team and waiting. The Google Workspace Updates announcement explains that with this feature, business users can go from query to dashboard without leaving Sheets, and data teams will get fewer one-off extraction requests. In this post, I'll go through what's new, how to set up Connected Sheets, how to ask Gemini, and what kinds of questions become possible when you apply it to GA4 data.
1. What's New in Gemini's BigQuery Analysis in Google Sheets?
The features introduced in the announcement can be grouped into three.
- Natural language questions: Ask something like "What were total sales in the Northeast region last quarter?" and it answers based on the full BigQuery data.
- Follow-up questions: Continue the conversation with something like "How does that compare to the same quarter last year?" to make comparisons or look for causes.
- Building dashboards: Describe the result you want, like "Create a quarterly sales review with sales by region, monthly trends, and the top 10 products," and Gemini first shows you a plan, gets your review, and then creates a new tab.
The key point is that Gemini's queries run on the full dataset in BigQuery, and the October 23 weekly recap reiterated the same explanation. To put it as an analogy, if Gemini in Sheets until now was an assistant who only read the papers spread out on your desk, this feature is closer to an assistant who gets the warehouse key and goes through the whole warehouse. So how do you get that warehouse key, meaning Connected Sheets, ready?
2. How Do You Set Up Connected Sheets?
According to the announcement, this feature works in spreadsheets connected to BigQuery, so you need to set up Connected Sheets first. The help article on getting started with Connected Sheets says you need access to Google Cloud and BigQuery, permission to view the table in question, and a project with billing set up in BigQuery. If you don't have a billing project, you can use the BigQuery sandbox, a free trial environment.
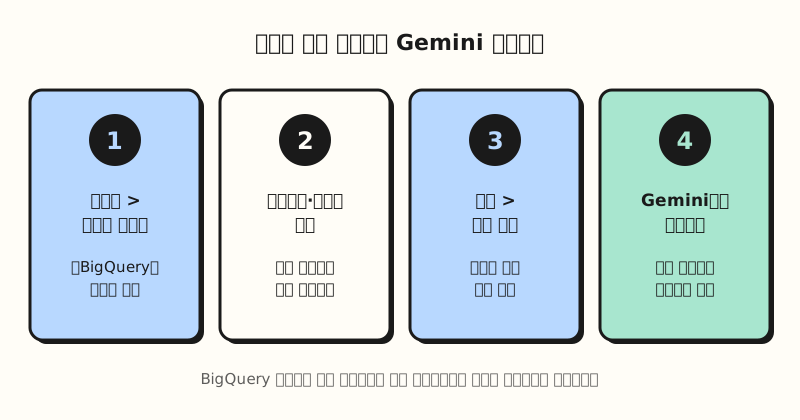 A figure combining the connection steps from the help article with how to get started from the announcement. (figure labels in Korean)
The connection flow is: in the spreadsheet, click Data > Data connectors > Connect to BigQuery, choose a project and table (or view), and then click Connect > Get started. Connected data doesn't sync automatically, so you need to click Refresh or set up a scheduled refresh. According to the help article on analyzing and refreshing, scheduled refreshes run under the account of the person who set them up. The same help article says pivot table results in Connected Sheets are limited to 100,000, and an extract into a regular tab is limited to 500,000 rows or 10 MB, so if you're planning a large dashboard, it's good to know these limits first.
3. How Do You Ask Gemini Questions and Hand Off a Dashboard?
Once you're connected, getting started is simple. According to the announcement, you just open the Gemini side panel in the connected spreadsheet, and it's on by default with no extra setup for users who can query the connected data. According to the Gemini in Google Sheets help article, you open the side panel with the Ask Gemini icon at the top right of the spreadsheet.
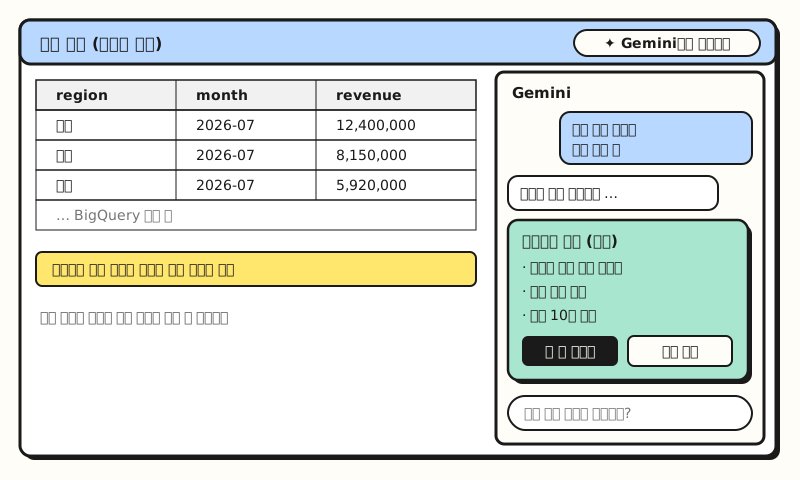 Example figure: not an actual screenshot but a simplified layout based on the announcement's description, with sample data. (figure labels in Korean)
Starting with a question about a single number, broadening to comparisons, and finally requesting a dashboard follows the same flow as the announcement's examples. When you request a dashboard, Gemini shows you a plan first instead of building it right away, so I recommend making a habit of checking at this stage that the metric names and date ranges match what you had in mind. Since the help article states that "Gemini features may suggest inaccurate or inappropriate information," it's safer to check a few numbers yourself with a pivot table before moving them into a report.
So how is this different from using Gemini in a regular sheet?
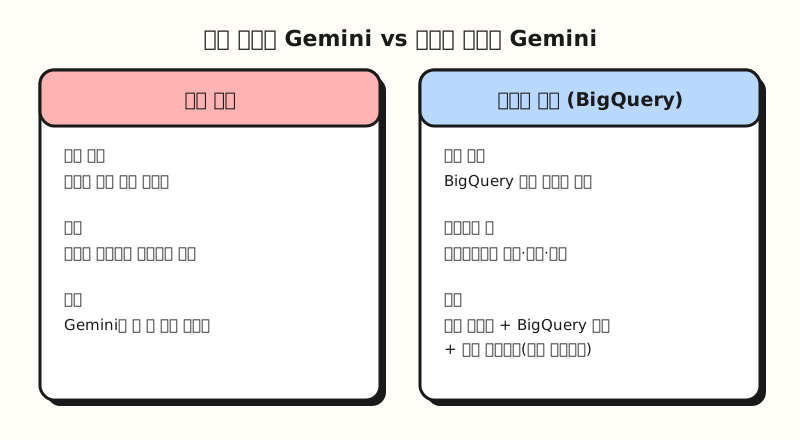 Both cases require a Google plan that includes Gemini. (figure labels in Korean)
The biggest difference is whether the output stays tied to the source. The Gemini help article notes that charts Gemini creates in a regular sheet don't reflect later changes to the source data, but this announcement explains that the dashboard tab is built with connected, refreshable formulas, pivot tables, and charts. Being able to refresh a dashboard you built once and reuse it next month is a pretty welcome part in practice.
4. What Can You Ask If You Send GA4 Data to BigQuery?
For marketers, the closest path to BigQuery is probably GA4's BigQuery export. According to the GA4 BigQuery Export help article, standard properties can also use the daily export and streaming export, and the daily export limit for standard properties is 1 million events. You can also export to the free sandbox, and the BigQuery sandbox documentation says it's free up to 10 GiB of storage and 1 TiB of query processing per month, and tables expire automatically after 60 days.
If you attach the GA4 event tables built up this way through Connected Sheets, it seems you could try asking Gemini questions like "Show me last month's purchase event count by source/medium" or "Which channels dropped compared to the previous month?" However, this is my own idea of applying the announcement's sales example to GA4, and the help article points out that what gets exported is raw events, so values added in reports in the GA4 interface are missing, which can cause differences from the interface numbers. So if you're asking about GA4 metrics like users, sessions, and engagement rate, it's a good idea to confirm the definitions are right when Gemini shows in the plan stage which events it will count and how.
※ Note: Plans, Rollout Timeline, and Caveats
Here's the availability and timeline stated in the announcement.
- Plans: Business Standard and Plus, Enterprise Standard and Plus, Google AI Pro and Ultra for individuals, Google AI Pro for Education, and the AI Expanded Access add-on.
- Rollout timeline: A gradual rollout starting October 19, 2026, and it may take up to 15 days for the feature to appear.
- Admin settings: On by default, with no admin control.
- Languages: The announcement doesn't list supported languages. However, the Gemini supported languages help article lists Korean among the supported languages for the Gemini side panel in Sheets.
One more thing worth pointing out is how this differs from other AI tools. The Claude for Google Sheets extension I covered last time couldn't read Connected Sheets tabs, so you had to extract to a regular tab first, but this Gemini feature sends questions to BigQuery right from those Connected Sheets. The Connected Sheets help article also notes that accessing BigQuery data from Connected Sheets is recorded in Cloud Audit Logs, so if it's company data, I recommend first checking who has access.
To sum up, this update lets Gemini answer based on the full data in spreadsheets with BigQuery attached through Connected Sheets, and even build refreshable dashboards. I'll also study how far I can hand off questions by attaching GA4 export data through Connected Sheets, and put it together again. For details, please refer to the Google Workspace Updates announcement and the Get started with Connected Sheets and Gemini in Google Sheets help articles.
FAQ
- Can I use Gemini's BigQuery analysis in Google Sheets with a free account?
- The announcement lists Business Standard and Plus, Enterprise Standard and Plus, Google AI Pro and Ultra for individuals, Google AI Pro for Education, and the AI Expanded Access add-on. Free personal accounts aren't on the list. On top of that, using Connected Sheets requires BigQuery access and a project with billing set up, and if you don't have a billing project, you can use the BigQuery sandbox.
- How are Connected Sheets different from regular Google Sheets?
- Connected Sheets keep BigQuery data connected instead of copying it into the sheet. You attach it through the Data > Data connectors > Connect to BigQuery menu and analyze it with pivot tables, charts, extracts, and calculated columns. The data doesn't sync automatically, so you need to refresh or set up a scheduled refresh.
- Do I have to rebuild a dashboard Gemini made when the data changes?
- According to the announcement, dashboard tabs built with this feature consist of connected, refreshable formulas, pivot tables, and charts, so you can bring in the latest data by refreshing. By contrast, the help article says charts Gemini creates in a regular sheet don't reflect later changes to the source data.
Related Posts
Here are posts that may help when looking at Google Sheets and data analysis together.
- Using Claude in Google Sheets, Docs, and Slides: Google Workspace Extension Beta - Another AI tool used inside Google Sheets, and its Connected Sheets limitation
- Google Sheets QUERY Function Basics: Use Your Sheet Like a Database - A function for asking about data in a sheet with SQL-like syntax
- What Is an Excel PivotTable? From Creating to Refreshing - The basic concept behind the pivot tables Gemini builds