Claude Dashboards is a feature where you connect a data warehouse such as BigQuery, ask questions in plain language, and Claude builds a dashboard by writing a SQL query for each chart. Anthropic opened it in beta to the Pro, Max, Team, and Enterprise plans on October 8, 2026, and on the same day it also released Claude Motion, which creates short explainer animations, in beta for the Team and Enterprise plans. In this post, I've summarized how the two features work, who can use them, and what marketers should check.
"Can I see last week's conversions by channel right now?" When you get a request like this right before a meeting, you often have to file a request with your data team or write the SQL yourself. Anthropic's announcement starts with exactly this scene: to ask questions of company data, you usually have to submit a request or write SQL, so people either wait or skip it altogether. Below, I'll walk through how Claude Dashboards and Claude Motion try to solve this problem, one at a time.
1. What's New with Claude Dashboards and Motion?
According to the announcement, three main things were released.
- Claude Dashboards (beta): Connects to your company's data platform, turns natural-language questions into dashboards, and keeps the dashboards up to date as the data changes.
- Claude Motion (beta): Turns reports or ideas into explainer animations that play like short videos, which you can download as MP4 files.
- Docs, Slides, and Design generally available: The features for creating documents, presentations, and designs have dropped their beta label and are available on all plans, including Free.
All three are built as Claude Artifacts (outputs created separately alongside the conversation). According to the Dashboards help article and the Motion help article, a dashboard is an artifact made from the dashboard template, an animation is an artifact made from the Motion template, and everything you create is saved in the Artifacts tab. So where, and how, does a dashboard get its numbers?
2. How Do Claude Dashboards Work?
First, you need to connect your data. The data warehouses the help article lists as examples are Amazon Redshift, BigQuery, ClickHouse, Databricks, and Snowflake, and you can also use other apps you've connected to Claude, such as Salesforce. Once connected, you can ask for a dashboard in chat, choose "Dashboard" under "Output" in the message box, or pick the dashboard template in the Artifacts tab and describe what you want.
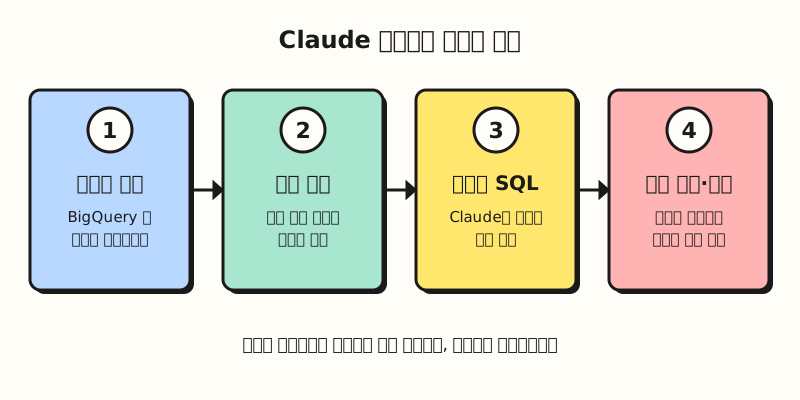 The connect, create, and refine sequence from the Claude Dashboards help article, laid out as steps (figure labels in Korean).
The key point is that every chart comes with the query that produced its numbers. According to the help article, Claude writes a SQL query for each chart and runs it against the data source, and each chart shows that query along with the time the data was last refreshed. It's a bit like a restaurant receipt that lists the price of every item, so if the total looks off, you can immediately point to the wrong line. If a number looks strange, open that chart's query to see what it's counting, and if it isn't what you intended, tell Claude what to fix.
As a tip for getting good results, the help article recommends asking the question you want answered rather than naming a chart. Instead of "a signups chart," it's better to ask something like "How do this month's signups by channel compare with last month?", and if you know the name of the table or app that holds the data, include it too. Dashboards start out private, visible only to you, and you can share them with others by clicking "Share."
3. How Can Marketers Working with GA4 Data Use It?
If you're already exporting GA4 data to BigQuery, you effectively have the ingredients to connect. According to the GA4 BigQuery Export help article, you can export raw events from a GA4 property to BigQuery and query them with SQL-like syntax, and the daily export sends the previous day's data once a day. Even though Claude Dashboards stays "up to date," it can only show what's in the data source, so if you only use the daily export, keep in mind that today's data won't be there yet.
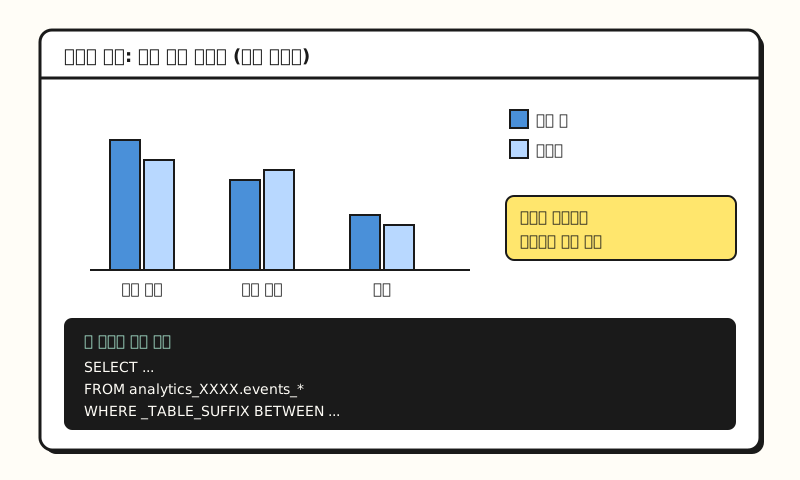 Example figure: not an actual screenshot but a simplified layout based on the help article's description, with made-up values (figure labels in Korean).
The Dashboards help article points to the Connecting apps to Claude help article for how to connect, and Claude's connector directory lists a BigQuery connector built by Google.
According to the Google Cloud documentation, among the tools of this BigQuery MCP server (the connection point that lets AI tools access BigQuery), execute_sql is not read-only, and there is a separate read-only execute_sql_readonly.
The same documentation explains that you can block execute_sql with an IAM deny policy, so if you only need to query data, I recommend agreeing on the scope of permissions with your data team before connecting.
It's also worth noting which questions it suits. The help article says dashboards are meant for quick exploratory questions like "How does this week's signup count compare with last month?", and suggests sending the work to other tools when you need deeper analysis. The announcement lists such tools as Amplitude, Grafana, Hex, Mixpanel, Omni, Perplexity, PostHog, and Sigma, with Looker, Tableau, and others to be supported soon. So rather than replacing your regular reports, think of it as closer to checking "Where does this number stand right now?" before a meeting. So what is Claude Motion, released on the same day?
4. How Is Claude Motion Different from AI Video Generators?
Going by the name alone, Claude Motion sounds like a video-generation AI, but it works differently. According to the Motion help article, Claude takes your prompt and builds the animation as code that moves text, charts, shapes, and images, and the result plays like a short video. Because it doesn't use a video generation model, it doesn't create photorealistic footage or people, and because it's code, you can change a single word, number, or timing while everything else stays the same.
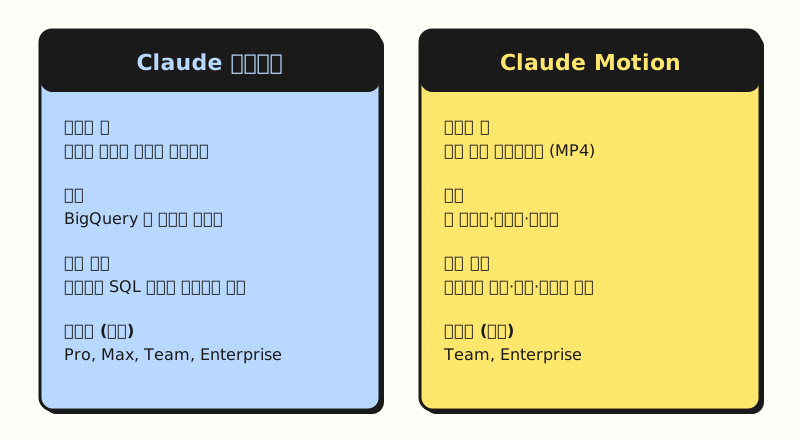 Both features are saved as artifacts and start out private (figure labels in Korean).
The examples in the official documentation are turning a quarterly report into a 30-second explainer video for an all-hands meeting, adding motion to the charts in a board presentation, and creating a product walkthrough video for customer onboarding. As a marketer, you could try applying it to summarizing the key numbers of a monthly performance report in a short animation, but that's a use I came up with based on the official examples. The help article recommends saying who will watch it, where it will play, and roughly how many seconds it should be, and attaching the report, data, or images you want to use.
Once the animation is done, you can download it as an MP4 from "Export," and according to the announcement, you can also open it in tools such as Adobe, Descript, HeyGen, and Runway to keep refining it. One thing to watch is usage: the help article notes that long or complex animations use more of your plan's usage limits than regular messages.
Note: Plans and Admin Settings
Both features are in beta, and they're available on different plans.
| Feature | Plans | Default setting |
|---|---|---|
| Claude Dashboards | Pro, Max, Team, Enterprise (beta) | Off on Enterprise until an owner turns it on |
| Claude Motion | Team, Enterprise (beta) | On for Team, off for Enterprise |
| Docs, Slides, Design | All plans including Free (generally available) | On by default for Enterprise from October 15 |
On the Team and Enterprise plans, owners can turn both features on or off under "Organization settings > Artifacts," and on Enterprise they can also open them only to specific groups using custom roles. If you don't see the menu in your company account, check the admin settings first. Also, if you've been using Claude Design separately at claude.ai/design, keep in mind that, according to the announcement, this standalone site will only remain until December 14, after which you will no longer be able to use the standalone version's chats, comments, or public links.
To sum up, Claude Dashboards is an exploration tool for quickly asking questions of your connected data and checking the query behind each chart, and Claude Motion is a tool for creating short explainer videos by animating your own materials with code. I'll come back to this as I study which questions I can hand off to dashboards when working with GA4 data. For details, see Anthropic's announcement and the Getting started with Claude Dashboards and Getting started with Claude Motion help articles.
FAQ
- Can I use Claude Dashboards on the free plan?
- No. According to the official help article, Claude Dashboards is available in beta on the Pro, Max, Team, and Enterprise plans. On the Enterprise plan, an owner has to turn it on in the Artifacts menu of the organization settings before it can be used. Docs, Slides, and Design, which became generally available on the same day, can be used on the Free plan as well.
- What data can I connect to Claude Dashboards?
- The help article gives data warehouses such as Amazon Redshift, BigQuery, ClickHouse, Databricks, and Snowflake as examples, along with other apps you've connected to Claude, such as Salesforce. GA4 data isn't connected to a dashboard directly; you can work with it by exporting it to BigQuery with BigQuery Export and then connecting that BigQuery.
- Can I trust the numbers in Claude Dashboards?
- Each chart shows the SQL query Claude wrote and the last refresh time, so you can check for yourself what was counted and how. If a query isn't what you intended, tell Claude what to fix. Before using it in a report, I recommend opening the query at least once.
- Does Claude Motion create AI videos with people in them?
- No. Claude Motion doesn't use a video generation model; it animates text, charts, shapes, and images with code, so it doesn't create photorealistic footage or people. You can download the result as an MP4, and it's available in beta on the Team and Enterprise plans.
Related Posts
Posts that may help when you look at Claude and hands-on data work together.
- Claude Marketplace launch: how connectors, skills, and plugins differ - The connector concept you use to connect data to dashboards
- GA4 users, sessions, and engagement rate explained - Metric definitions to know before viewing GA4 numbers in a dashboard
- What is an Excel PivotTable? From definition to building and refreshing - Another way to summarize data quickly