A box and whisker chart is a statistical chart that shows where numbers cluster and how spread out they are, using a single box and lines (whiskers) extending above and below it. Starting October 22, 2026, this chart is gradually rolling out to Google Sheets as a built-in chart type. Just select your numbers, and Sheets calculates the minimum, quartiles, median, maximum, and outliers for you. Another change that came with it: box and whisker charts made in Excel now stay intact instead of disappearing when you import them.
"The average CPC is similar across campaigns, so why do some campaigns have so many unusually expensive days?" If you look at daily ad data, you'll probably get this question at some point, and a single average doesn't reveal the difference well. The box and whisker chart is the chart that shows on one page whether values are evenly clustered or all over the place. In this post, I'll cover how to read a box and whisker chart, how to make one in Google Sheets, its options, and how it differs from Excel.
What does a box and whisker chart (box plot) show?
The Google Sheets box and whisker chart help article describes each part of the chart like this.
- Box: The range from the first quartile (25th percentile) to the third quartile (75th percentile), that is, the middle half of the values. This width is called the interquartile range (IQR).
- Median line: The line across the box, marking the very middle (50th percentile) when values are lined up by size.
- Whiskers: The lines extending up and down from the box. Google Sheets draws the whiskers to the smallest and largest values within 1.5 times the interquartile range.
- Outliers: Values that fall outside the whiskers, plotted separately as points.
Think of it like lining up students in a class by height. The student in the very middle is the median, the group in the middle after removing the front quarter and the back quarter is the box, and any student who's unusually tall or short and seems to stand far from the line is an outlier.
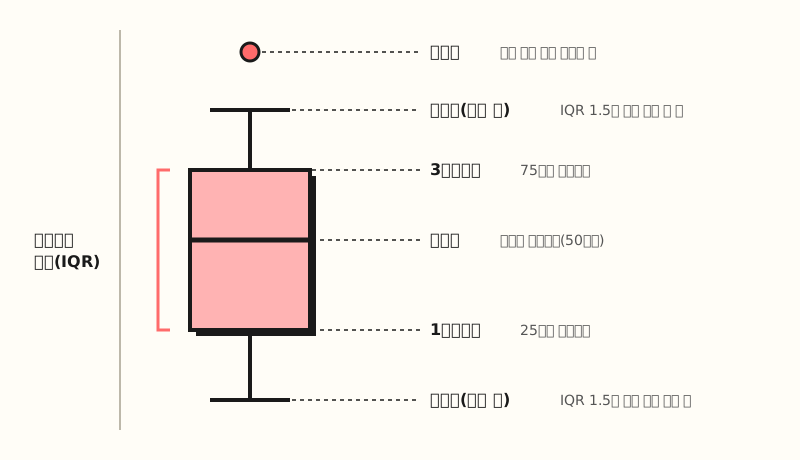 Example figure: The names of the parts of a single box and whisker chart. The whisker length rule (1.5 times the IQR) follows the Google Sheets help article (figure labels in Korean)
While a histogram, another distribution chart, splits values into ranges (buckets) and shows them as bars, a box and whisker chart condenses the distribution into about five reference points. That makes it especially easy to read when comparing several groups side by side, like campaigns or days of the week. So how do you make one in Google Sheets?
How do you make a box and whisker chart in Google Sheets?
First, get your data into the right shape. According to the help article, the first column can hold labels that divide groups, such as campaign, department, or year (optional), and when you put numeric values in the following columns, one box is drawn per column or group. The key point is that you can use raw values stacked one row per day as-is rather than summarized numbers, so there's no need to calculate quartiles separately with helper formulas.
The steps are almost the same as for other charts.
- Select cells: Select the data range you want to chart.
- Insert > Chart: Click it in the top menu, and the chart editor opens on the right.
- Setup tab: Scroll down the "Chart type" list and choose Box and whisker chart under Statistical.
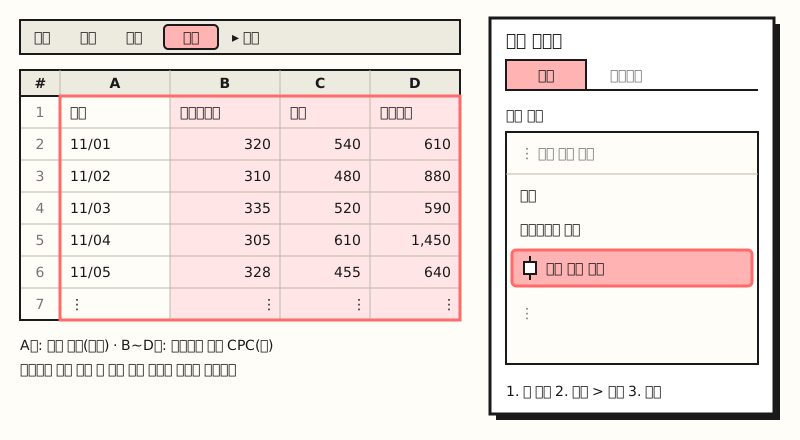 Example figure: A diagram, not an actual screen capture, and the numbers are sample data. Giving each campaign its own column draws three boxes (figure labels in Korean)
When you chart three campaigns side by side like this, reading it is simple. First, compare the height of the median lines to see the typical level, then look at the length of the boxes and whiskers to see how much it fluctuates day to day. A campaign with a short box has stable costs, while one that stretches long varies a lot from day to day. Finally, find the points outside the whiskers and check the raw rows to see what happened on those days.
If your data already has summary statistics like the minimum, maximum, and quartiles, the help article recommends using a candlestick chart (titled "Stock chart" in the Korean help center) instead of a box and whisker chart. That's because the box and whisker chart calculates the statistics directly from the raw values.
What do the outlier, mean, and quartile options change?
After creating the chart, go to Customize > Series in the chart editor to adjust the following options.
- Show outlier points: Shows values outside the whiskers as points. If your goal is finding those "unusually expensive days," it's best to leave this on.
- Show mean markers: Adds a marker at the mean value for each series.
- Show mean line: Connects the mean markers of multiple groups with a line.
- Quartile calculation: Choose between including or excluding the median when calculating quartiles.
Turning on mean markers as well turns out to be surprisingly useful. The mean is easily pulled by a few large values, so if the median line and the mean marker are far apart, you can read it as a sign that a few extreme days are pulling the mean up.
The quartile calculation shifts the box position slightly when there are few values.
Excel's box and whisker chart help article explains that when the number of data points (N) is odd, inclusive median includes the median in the calculation and exclusive median leaves it out.
If you want to check the quartiles plotted on the chart as numbers, calculate them in the sheet with a function like =QUARTILE.INC(B2:B31, 1) and compare. The QUARTILE.EXC function calculates over a range that excludes the 0th and 4th quartiles, so the two results may differ.
How is it different from Excel's box and whisker chart?
In Excel, box and whisker charts are available as a built-in chart in Excel 2016 and later for Windows and in Microsoft 365. In Excel for Windows, select your data, then choose Box and Whisker from the Statistic Chart icon on the Insert tab. Right-click the box and open Format Data Series to find the options. The options are nearly the same as in Google Sheets, but the Excel help article also includes Show inner points, which plots every value inside the whiskers as a point, and Gap width, which sets the spacing between boxes.
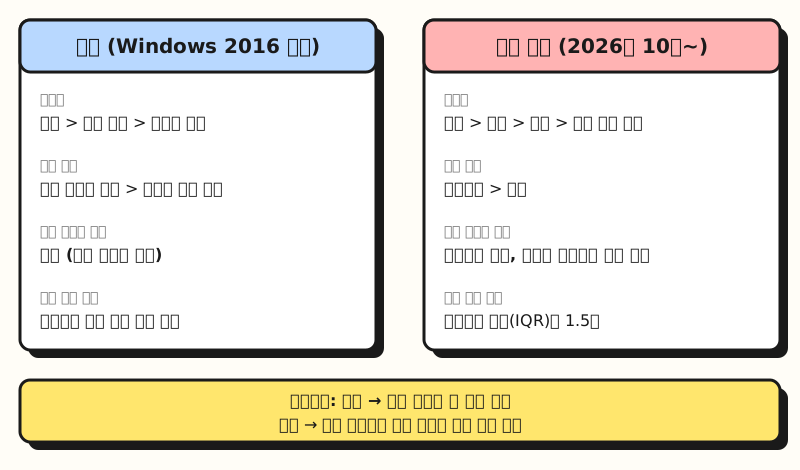 Example figure: A comparison card listing the menu names and options from both help articles side by side (figure labels in Korean)
The Google Sheets update announcement says you can turn inner points on and off, but at the time of writing, the option list in the Korean help article doesn't include that item yet, so I recommend checking the actual menu. Also, Excel only describes whiskers as lines showing "variability outside the quartiles" and doesn't state a length rule, so it's hard to say for sure that the whisker ends will be exactly the same in both programs, even with the same data.
The most welcome change is when exchanging files. According to the announcement, until now, importing an Excel file containing a box and whisker chart into Google Sheets dropped the chart entirely. Now data references, calculations, and formatting are all preserved, and charts made in Sheets become editable box and whisker charts when exported to Excel.
Note: Can you use it right now?
Box and whisker charts don't open to all accounts at once; they roll out gradually.
| Track | Rollout starts | Notes |
|---|---|---|
| Rapid Release domains | October 22, 2026 | Gradual rollout, up to 15 days for the feature to appear |
| Scheduled Release domains | November 6, 2026 | Gradual rollout, up to 15 days for the feature to appear |
It's available to all Google Workspace customers and users with personal Google accounts, and there's no admin setting to turn it on or off. So on a work account, the box and whisker chart may not yet appear under "Statistical." Before adding it to a shared report, it's safer to check that the chart displays properly on your colleagues' screens too.
To sum up, the box and whisker chart shows on one page the spread of values and the outliers that a single average hides, and in Google Sheets you can make one by selecting the raw numbers and going to Insert > Chart > Statistical > Box and whisker chart. I'm planning to add this chart next to the average table when I look at fluctuating numbers like daily metrics per campaign. For detailed descriptions of the options, please see the box and whisker chart help article.
FAQ
- Are a box plot and a box and whisker chart the same chart?
- Yes, they're the same chart. In English it's called a box plot or a box and whisker chart, and the Google Sheets and Excel help articles use the name box and whisker chart.
- How are outliers determined in a Google Sheets box and whisker chart?
- According to the Google Sheets help article, the whiskers are drawn to the smallest and largest values within 1.5 times the interquartile range (IQR), and values outside that are shown as outliers. You can turn Show outlier points on or off under Series in Customize.
- If I import an Excel box and whisker chart into Google Sheets, does the chart stay?
- According to the Google Workspace update announcement, the chart, data references, calculations, and formatting are now preserved on import, and charts made in Sheets are exported as box and whisker charts you can edit in Excel. Because it's a gradual rollout, timing may differ by account.
- Can I use a table with only summary statistics (minimum, quartiles) for a box and whisker chart?
- The Google Sheets help article recommends using a candlestick chart instead of a box and whisker chart if your data already contains summary statistics. That's because the box and whisker chart calculates the statistics directly from raw numbers.
Related posts
Posts worth reading alongside this one when building clear reports in Sheets and Excel.
- Creating Pivot Tables in Google Sheets | The New Compact Layout and Excel Compatibility - How to summarize your data before putting it into a box and whisker chart
- Building PivotTable Reports | See It All at a Glance with Slicers and PivotCharts - The next step in dressing up reports with charts in Excel
- Ad Metrics Basics: How to Calculate CPC, CPM, CTR, Conversion Rate, and ROAS - How to calculate ad metrics like the CPC used in the examples