GA4 Explorations are a space where you pick your own dimensions, metrics and segments to break down questions that the fixed tables of standard reports struggle to answer. There are seven techniques, including free form, funnel and path exploration, and which one you pick depends on the shape of your question. That said, there are constraints like data retention, sampling and sharing permissions, and if you don't know about them it's easy to misread the numbers.
"Can we see where the people who added items to their cart last month but never checked out dropped off?" When you get a question like this, you often end up bouncing between standard report menus before finally opening Explorations. But then the blank screen opens, and the Variables panel and Tab settings feel so unfamiliar that you don't know where to start. Sound familiar? In this post, let's look at how Explorations differ from standard reports, which question each of the seven techniques is for, and how to follow a funnel exploration from start to finish.
1. How are GA4 Explorations different from standard reports?
The Explorations help article introduces Explorations as a collection of advanced analysis techniques that let you look at customer behavior more deeply than standard reports. You get there by clicking Explore in the left menu, and you can start from a blank exploration or pick a template to get going quickly.
A restaurant analogy makes the difference clear. Standard reports are the set menu the kitchen has already decided on, so everyone who orders gets the same thing, while Explorations are closer to an open kitchen where you pick the ingredients (dimensions and metrics) and cook the dish you want. The freedom is greater, but just as picking the wrong ingredients gives you the wrong dish, a wrong setting in Explorations can produce a table that looks plausible but is wrong, so it's important to get in the habit of checking conditions one by one.
| Criteria | Standard reports | Explorations |
|---|---|---|
| How they're built | Open a pre-built report | Pick dimensions, metrics and segments yourself |
| Who can see them | People with access to the property | Only the creator at first; read-only once shared |
| Affected by data retention | No | Yes (events past the retention period can't be seen) |
| Good for | Checking the same metrics in the same format every week | Digging deep once into a specific group, sequence or path |
The screen is split into three parts. In the Variables panel on the left you bring in the date range and the dimensions, metrics and segments for this analysis, then in Tab settings in the middle you pick a technique and drag variables into the rows, columns and values slots, and the result is drawn on the canvas on the right.
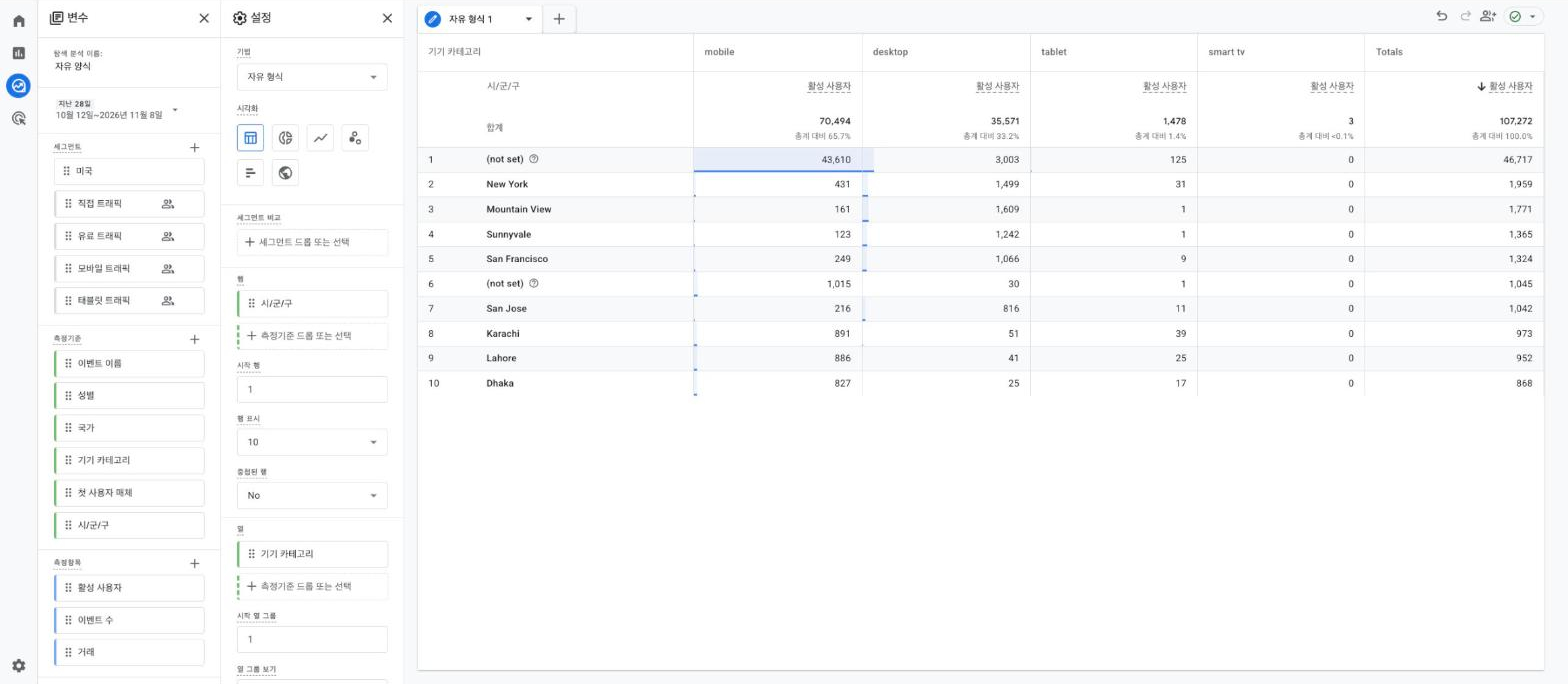 Source: GA4 demo account (Google Merchandise Store). From left: Variables, Tab settings and the canvas (screen in Korean)
2. Which of the seven exploration techniques fits which question?
The help article lists seven techniques, and it gets much easier if you choose based on "what shape is my question?" rather than the feature names.
| Technique | For questions like | Example marketer question |
|---|---|---|
| Free form exploration | When you want to cross numbers by several criteria | Key events by source/medium × device |
| Funnel exploration | Where people drop out of steps you defined | Product view → cart → begin checkout → purchase |
| Path exploration | Where people actually went, without a set order | Pages most viewed after the landing page |
| Segment overlap | How much two or three groups overlap | Mobile users who also purchased |
| Cohort exploration | How a group that arrived at the same time behaved afterward | Return visits of users acquired in a campaign's first week |
| User explorer | The activity of individual users in a group | Looking into users with unusually many events |
| User lifetime | The value and behavior users left over their whole lifetime | Revenue left by users, compared by first acquisition channel |
The most common confusion is between funnel and path exploration. A funnel is where you define the steps first and look at the share of people passing through them, while path exploration is where you don't define steps and unfold the routes users actually took as a tree. If the answer is a rate, as in "what percentage purchased after beginning checkout," pick a funnel; if the answer is a route, as in "what did people who left the checkout page view before that," pick path exploration.
Free form is a crosstab that crosses rows and columns, so if you've used Excel pivot tables, it's the easiest one to get comfortable with first. According to the free form help article, you can place up to 5 dimensions as rows and up to 2 as columns, and you can set the cell type to plain text, bar chart or heat map to see the size of numbers as color. Besides a table, the visualization can be switched to donut, line, scatterplot, bar or geo map charts.
3. How do you look at cart drop-off with a funnel exploration?
Let's follow, from start to finish, a scene where someone running ads for an online store checks the concern that "people get as far as the cart, but few purchase."
This example assumes the site sends the online sales events from the recommended events list (view_item, add_to_cart, begin_checkout, purchase).
- Open the Explore > Funnel exploration template.
- Under Steps in Tab settings, create four steps, giving each a name (Product view, Cart, Begin checkout, Purchase) and a condition (event name equals the event above).
- Choose open or closed. If you only want the flow of people who went through a product view, choose closed; if you also want to see people who entered from the cart, choose open.
- Put device category in Breakdown to compare drop-off points on mobile and desktop side by side.
- Turn on Show elapsed time to see the average time between steps, and put page title in Next action to see what people did after finishing a step.
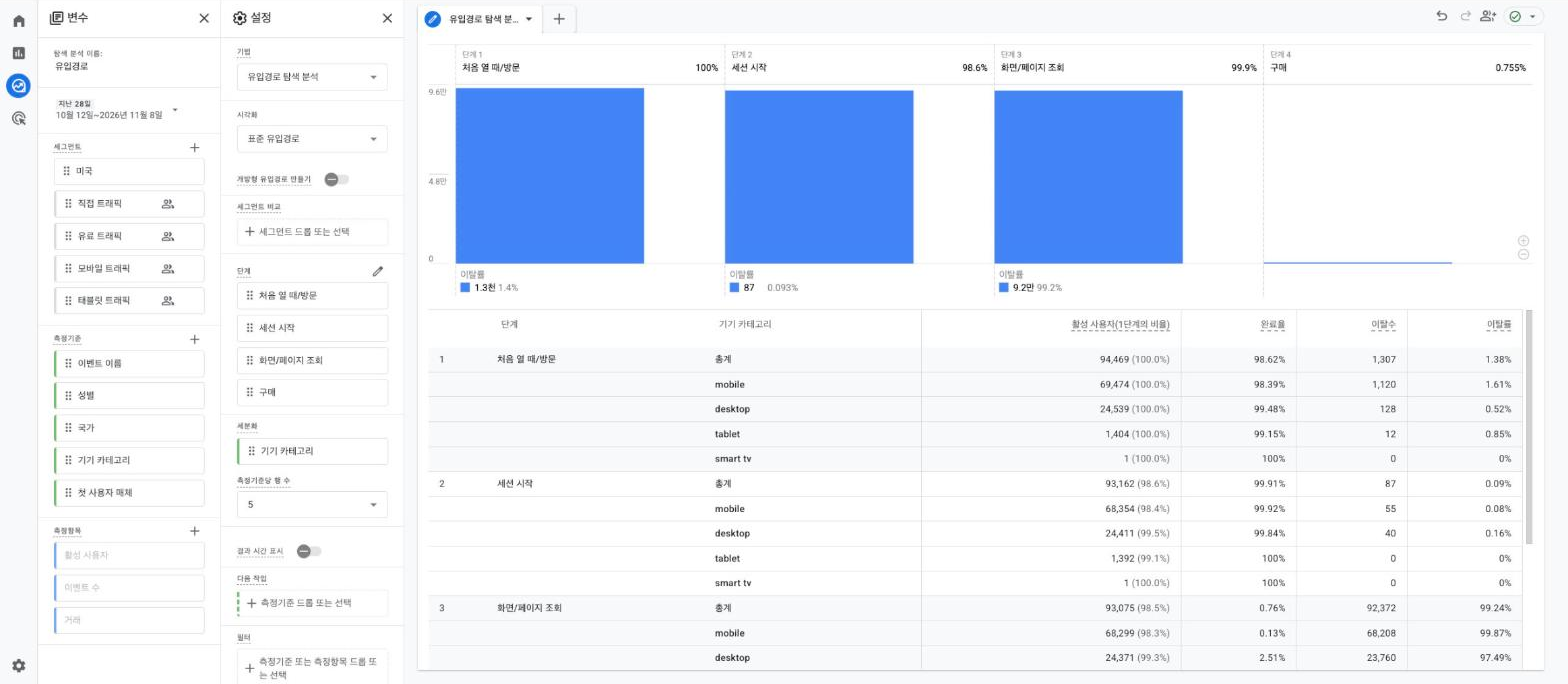 Source: the funnel exploration template in the GA4 demo account (Google Merchandise Store). The settings panel lists steps, breakdown, make open funnel, show elapsed time and next action in order (screen in Korean)
The funnel exploration help article has a few rules worth knowing. You can create up to 10 steps, you can choose whether a new step is directly followed by the previous one (no other actions in between) or indirectly followed by it (other actions allowed in between), and you can also set a time limit for each step. On the other hand, you can't create steps based on metrics, such as "purchase amount of 50,000 won or more," so conditions like that have to be handled with event parameters or segments.
The difference between open and closed changes the numbers a lot. In an open funnel users can enter at any step, while a closed funnel only counts users who entered at the first step. In both, a user who doesn't complete a step is treated as having dropped out and is removed from later steps, so someone who entered from the cart without going through a product page is counted from the cart step in an open funnel and not at all in a closed one. So the two approaches give different numbers from the same data, and rather than one being right, what matters is picking the one that fits your question and noting which one you used in the report.
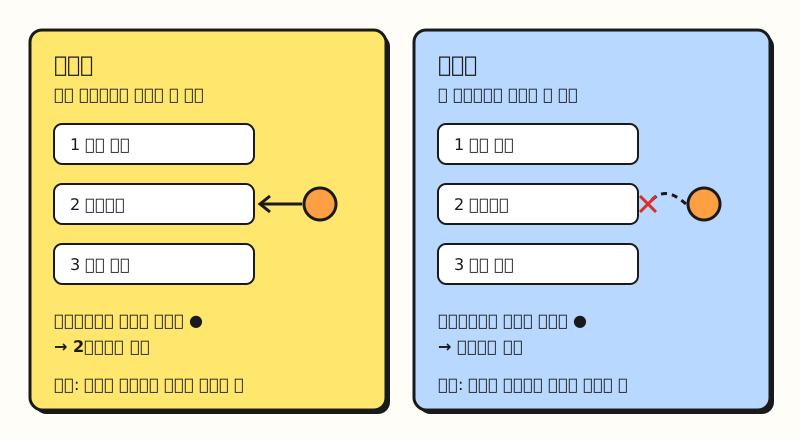 Open funnels count users who enter at a middle step from that step on; closed funnels only count users who enter at the first step (figure labels in Korean)
If the top 5 next actions card shows "(no next action)," it's usually read as drop-off, but the help article points out that with page or screen dimensions it may mean the value didn't change rather than that the user left. Once you've found the drop-off point, another option is to follow the path exploration help article, set the ending point to the checkout page and unfold the path backward. In path exploration you can set only one of the starting point or ending point, each step shows the top 5 nodes by default, and clicking More raises that to 20. If the tree gets messy because events repeat on the same page, turn on View unique nodes only.
4. ※ Note: What should you check first when the numbers look off?
If the numbers in an exploration differ from standard reports or come up empty, I'd recommend checking the constraints below before going back over your settings from scratch.
- Data retention: According to the data retention help article, this setting only affects explorations and funnel reports, and standard properties can choose 2 months or 14 months for event data. The Explorations help article says the default is 2 months, so if you want to compare against the same month last year, you need to change it to 14 months ahead of time with Editor or higher permissions.
- Sampling: In standard properties, if a query includes more than 10 million events, the results may be based on sampled data. The sampling help article says the data quality icon shows the share of data used, and shortening the date range helps avoid sampling.
- Data thresholds: According to the thresholds help article, when demographic or search query data is included, some rows may be withheld so individuals can't be inferred, and users can't adjust these thresholds. It says widening the date range may bring hidden data into view.
- Limits: Per the Explorations help article, each user can create 200 individual explorations per property, the property as a whole can have 500 shared explorations, a single exploration can use 20 dimensions and 20 metrics, and each tab can have up to 10 filters. According to the segments help article, you can create up to 10 segments per exploration and apply up to 4 at once to a technique.
- How date ranges are saved: If you save with a preset range like "Last 28 days," the period moves each time you open it; if you save with a custom date range, that period stays fixed. For weekly checks, saving with a preset range is more convenient.
5. What should you know to use them with your team?
When you first create an exploration, it's visible only to you. Once shared, everyone with read access to the property can see it but can't edit it, so anyone who wants to change it has to make a copy and edit that. According to the roles help article, Viewers can also create and edit their own explorations, but sharing with other users requires the Analyst role or higher. The Explorations help article also notes that only the creator can delete an exploration.
Looking at this setup, it seems worth agreeing on how your team uses them. Here are the guidelines I came up with while studying this.
- Numbers you check in the same format every week stay in standard reports, and Explorations are for digging in when a question comes up.
- Explorations you share get a name that includes the purpose and criteria (for example, "Cart drop-off_closed_by device"). Shared copies are read-only, so people need to know what they're looking at from the name alone.
- Segments are only visible inside the exploration where they were created, so for segments the team will share, it's better to have someone with Editor or higher create them as property-level segments. According to the segments help article, every user in the property can apply property-level segments to their own explorations.
Wrapping up
With GA4 Explorations, picking the technique that fits the shape of your question is half the work. Start with free form for numbers you want to cross, funnels for drop-off across defined steps and path exploration for the routes people actually took, and if the numbers look off, check retention, sampling and thresholds first. As I work through real questions with Explorations, I'll share any settings I find more useful. For each technique's detailed options, please refer to the help articles linked in this post.
FAQ
- Why can't I see last year's data in GA4 Explorations?
- It's most likely because of your data retention setting. This setting only affects explorations and funnel reports, and standard properties choose between 2 months and 14 months. Event data past the retention period can't be seen in Explorations, so if you need long-range comparisons, change it to 14 months ahead of time.
- What's the difference between open and closed funnels in GA4 funnel exploration?
- In an open funnel users can enter at any step, while a closed funnel only counts users who entered at the first step. In both, a user who doesn't complete a step is treated as having dropped out and is removed from later step counts, so the same data can give different numbers.
- When should I use GA4 path exploration versus funnel exploration?
- Use funnel exploration when you want to define steps in advance and see drop-off rates per step, and path exploration when you want to unfold the actual sequence of pages or events users went through without defining steps. In path exploration you can set only one of the starting point or ending point.
- Can I show an exploration I made to my teammates?
- Once shared, people with read access to the property can see it. However, sharing requires the Analyst role or higher, and shared explorations are read-only, so to edit one you need to make a copy.
Related posts
Posts that help when you're working out which events and metrics to put into Explorations.
- GA4 Events and Parameters: Automatic, Enhanced, Recommended, Custom - The event structure used in funnel steps
- GA4 Users, Sessions, Engagement Rate, and Bounce Rate Explained - Definitions of the metrics you pick in Explorations
- Excel PivotTable Guide: What It Is, How to Create and Refresh - The basics of the rows, columns and values layout that free form resembles