Landing page optimization means refining a page so that people who click your ad find what they saw in the ad right away and can easily get to the action they want. Google Ads evaluates this as landing page experience, one component of Quality Score, and its help articles recommend matching the ad, useful content, easy navigation, and mobile-friendliness and load speed as ways to improve. In this post, I'll go over what makes a good landing page, where to check it, and which tools to use for auditing.
"My click-through rate is fine, so why aren't I getting conversions?" If you look at ad reports, you've probably asked this at least once. No matter how much you polish your creatives and keywords, if the page people land on after clicking isn't what they expected, they'll quickly hit the back button. That's why, when you look at ad performance, you also need to look at the landing page, which sits outside the ad (the Korean versions of Google Ads help articles call it the "visit page").
What Is Landing Page Optimization, and Why Does It Matter for Ads?
A landing page is the first page a user sees when they arrive on a site. The GA4 Landing page report help article defines it as "the page path and query string associated with the first pageview in a session," and in advertising terms, you can think of it as the very page that opens when someone clicks your ad.
Let me compare it to a store you visit after seeing a flyer. If the flyer said "30% off winter coats" but the store entrance only displays summer sandals and there's no staff to ask where the coats are, most people would just walk out. If the ad is the flyer, the landing page is the store entrance, and landing page optimization is closer to putting the item from the flyer at the entrance.
Google Ads evaluates this connection separately, too. According to the Quality Score for Search campaigns help article, Quality Score is shown at the keyword level on a scale of 1 to 10 and is made up of three components: expected clickthrough rate, ad relevance, and landing page experience. Of these, landing page experience is "how relevant and useful your landing page is to people who click your ad."
How Does Google Describe a Good Landing Page?
Putting together the Optimize your ads and landing pages help article and 5 ways to improve your performance using Quality Score, Google's conditions for a good landing page come down to four.
- Matches the ad and keywords: Choose a page closely tied to your ad and keywords, and make sure the offers or calls to action in your ad can be found on the page too. As in the help article's example, someone who clicks an ad for "flannel shirts" should see flannel shirt products.
- Useful, original content: Clearly describe your product or service and its features; Google also recommends having a review section that shows real customer opinions.
- Easy navigation: Make it easy to take the action people want, such as ordering, calling, or submitting an inquiry, and put important information at the top of the page. Google advises against including too many ads or pop-ups.
- Mobile-friendliness and load speed: Google says to provide fast speed and simple navigation for mobile users, because how quickly a page loads can determine whether users leave or buy.
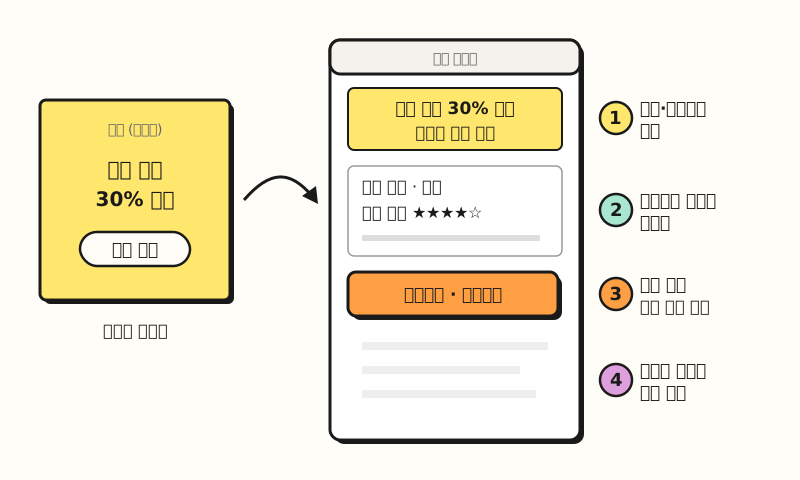 Figure: the landing page improvement directions from two Google Ads help articles, grouped into four. (figure labels in Korean)
Of the four, the first is the one to look at first. If you're sending all your keywords to a single homepage, I recommend first considering connecting each ad group to its own page where content matching the ad copy is visible on the first screen.
Where Do You Check Landing Page Experience?
In Google Ads, you check it with columns on the Keywords page. According to the Quality Score help article, you can open the "Quality Score" section when modifying keyword columns and add Quality Score and its three components as columns. Each component is shown in one of three levels, Above average, Average, or Below average, and this rating is a comparison with other advertisers' ads that showed for the same searches over the last 90 days.
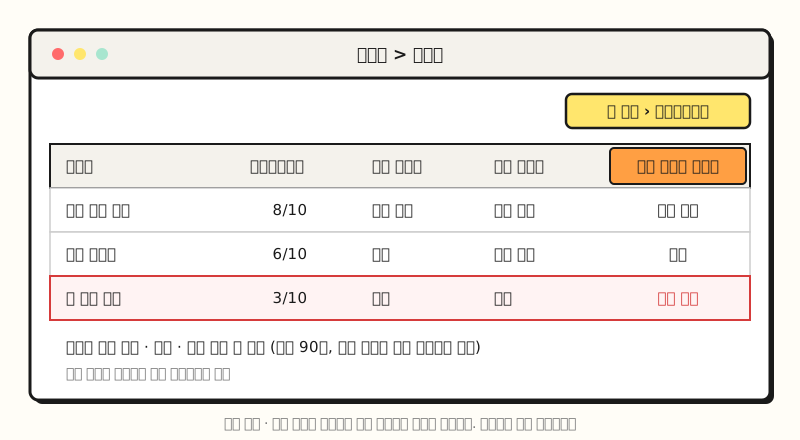 Illustration: a simplified drawing of the screen layout, not an actual capture. Keywords and status values are fictional examples. (figure labels in Korean)
If landing page experience is "Average" or "Below average," it may mean there's room to improve. However, the same help article states that "Quality Score isn't a key performance indicator and shouldn't be optimized or aggregated with the rest of your data," and also explains that Quality Score itself isn't an input in the ad auction. That doesn't mean page quality is irrelevant to the auction, though, because the Ad Rank help article explains that Ad Rank is calculated based on your bid and "the quality of your ads and landing page," among other factors. The goal isn't to raise the score number; use it as a diagnostic signal for choosing which keyword's page to work on first.
The 5 ways help article also recommends using conversion rate as a measure for judging landing page experience. It explains that while conversion rate doesn't affect your landing page status, it can be a good way to measure and optimize your pages. It also notes that advertisers without permission to edit their site directly can use experiments to find which of their existing pages works best.
What Standards Should You Use to Check Page Speed?
Since it's hard to judge speed by feel, it's better to look at numbers using the tools Google provides. PageSpeed Insights reports the user experience on mobile and desktop separately, shows both real-user data (the last 28 days from the Chrome User Experience Report) and lab data, and gives improvement suggestions. However, for new pages with little traffic, the real-user data may be replaced with site-wide data or not shown at all.
The standard used here is Core Web Vitals, metrics that measure real users' experience of loading, responsiveness, and visual stability. Putting the "Good" thresholds from Google Search Central's Core Web Vitals documentation into a table looks like this.
| Metric | What it measures | Good threshold |
|---|---|---|
| LCP (Largest Contentful Paint) | Loading performance | Within 2.5 seconds of when the page starts loading |
| INP (Interaction to Next Paint) | Responsiveness | 200 milliseconds |
| CLS (Cumulative Layout Shift) | Visual stability | 0.1 |
How the boundary is phrased differs slightly by document. The Google Search Central documentation writes INP and CLS as "less than 200 milliseconds" and "less than 0.1," while the web.dev Web Vitals article and the PageSpeed Insights documentation say "or less," so I've put only the threshold numbers in the table. Both the web.dev article and the PageSpeed Insights documentation also note that measurement is based on the 75th percentile of page loads.
There's one more distinction to make. The Core Web Vitals documentation is written from the perspective of Google Search (organic search), and in the Google Ads help articles I reviewed for this post, Core Web Vitals numbers didn't appear as criteria for landing page experience. The basis on the ads side is the explanation that "load speed affects bounces and purchases," and the numeric thresholds are borrowed as a common yardstick for checking page experience.
How Do You Compare Performance by Landing Page?
You can see which page to fix first by putting each page's numbers side by side, and Google Ads and GA4 each have a landing page report.
- Google Ads "Landing pages" page: According to the Evaluate landing page performance help article, it's under "Insights and reports" in the Campaigns menu, and shows clicks, impressions, and CTR by landing page URL for Search, Display, Video, and Shopping campaigns, along with "Mobile-friendly click rate" and "Valid AMP click rate" columns. A mobile-friendly click rate below 100% is a signal that there may be problems on mobile.
- GA4 "Landing page" report: According to the GA4 help article, it's under "Engagement > Landing page" in the Reports menu, and shows sessions, active users, new users, average engagement time per session, key events, and total revenue by page. Add "Session source / medium" as a secondary dimension, and you can break down which traffic source each landing page came from.
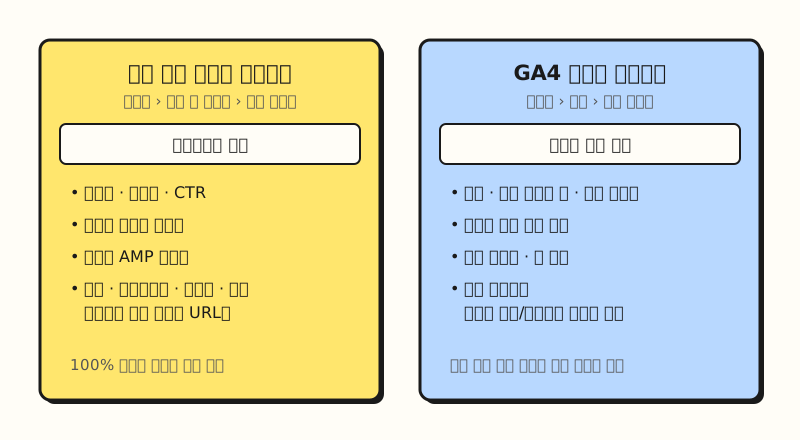 Figure: Google Ads shows ad metrics around the click and mobile status, while GA4 shows engagement and key events after arrival. (figure labels in Korean)
The two reports cover different stages. The Google Ads side shows performance up to the click and mobile status, while the GA4 side shows how long people stayed after arriving and whether it led to key events. I recommend this order: narrow GA4's session source / medium to Google Ads traffic, find pages with many sessions but few key events, then check in turn whether each page matches the ad copy, whether important information and buttons are at the top, and whether it's slow on mobile.
Summary: Where Should You Start with Landing Page Optimization?
In the end, landing page optimization is about making the page keep the promise the ad made. I recommend using Quality Score's landing page experience to pick the keywords to work on, checking the differences between pages with the Google Ads and GA4 landing page reports, and then reviewing the four areas in turn: matching the ad, content, navigation, and speed. I'm also going to review this blog's post pages against the same criteria, and if I have more to share, I'll write about it. For the original wording of each criterion, see the Google Ads and Analytics help articles linked above.
FAQ
- Is 'landing page' the same as the 'visit page' in Korean Google help?
- Yes, they refer to the same thing. The Korean versions of Google Ads and GA4 help translate "landing page" as "visit page" (방문 페이지), and it means the first page a user sees when they click an ad or arrive on a site.
- If landing page experience is 'Below average', will my ads not show?
- Google Ads help doesn't say that a single status value determines whether ads show. It explains that Quality Score itself is a diagnostic tool that isn't an input in the ad auction, and that Average or Below average may mean there's room to improve. However, Ad Rank is calculated based on your bid and the quality of your ads and landing page, among other factors, so low page quality can put you at a disadvantage in the auction.
- Which tool should I use to check page speed for landing page optimization?
- Enter a URL into Google's PageSpeed Insights to see Core Web Vitals (LCP, INP, CLS) and improvement suggestions for mobile and desktop separately. According to the Google Search Central documentation, the "Good" thresholds are LCP within 2.5 seconds, INP of 200 milliseconds, and CLS within 0.1.
Related Posts
- How to Optimize Search Ads - Finding performance problems by stage: keywords, creatives, and landing pages
- Ad Metrics Basics: How to Calculate CPC, CPM, CTR, Conversion Rate, and ROAS - How to calculate the conversion rate to compare before and after improving a landing page
- GA4 Users, Sessions, and Engagement Rate Explained - How to read the session and engagement metrics in the landing page report