An SQL ad performance report is a query that summarizes an ad spend table and an orders table by channel separately, joins the two summaries, and then calculates ratios like ROAS and CPA on top. In this final post of the series, we use SELECT, WHERE, GROUP BY, JOIN and WITH all in one query, and as long as you keep the order, the only new things are two functions: SAFE_DIVIDE for division and ROUND for rounding. When I started learning SQL, "join the two tables and give me ROAS by channel" was the request that sounded most daunting, but once I broke it into steps, it turned out to be a combination of things we'd each used once in earlier posts. In this post, let's build the report query from start to finish with a sample ad spend table and orders table. Queries are written in BigQuery (GoogleSQL) syntax. Previous post: SQL Subqueries and WITH (CTE): Breaking Up Long Queries
SQL Basics series 12/12 · Full curriculum
The concept for today
Imagine building an ad report in Excel. If ad spend and orders are on separate sheets, you'd usually make a pivot table on each sheet to get totals by channel first, place the two summaries side by side by channel name, then write =revenue/cost in the next column to get ROAS. An SQL report query follows exactly the same order. The pivot table is GROUP BY, placing summaries side by side is JOIN, the division in the next column is a calculated column in SELECT, and each summary table you make along the way gets a name with WITH.
We use three metrics here. The Google Ads target ROAS help page calculates $5 in sales from $1 in ad spend as 5 ÷ 1 × 100% = 500%, so ROAS is revenue ÷ ad cost × 100. The conversion data help page describes cost per conversion (CPA) as total cost ÷ conversions and conversion rate as conversions ÷ interactions such as clicks. If the metrics themselves are new to you, you may want to read the ad metrics basics post first.
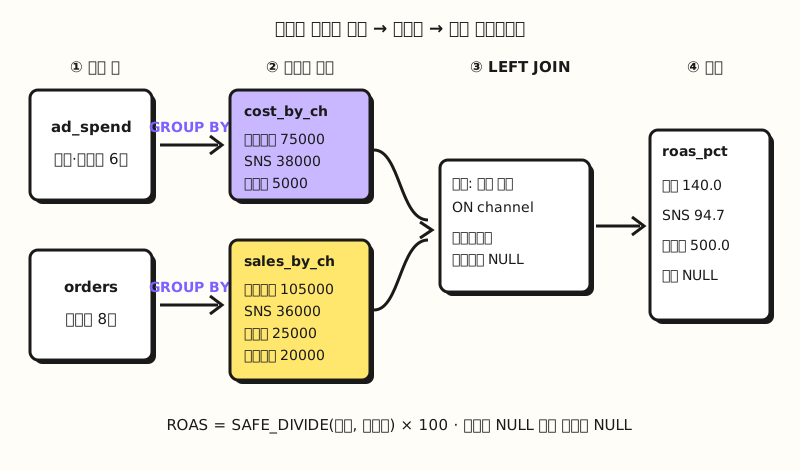 Concept figure: summarize each table by channel first, join the summaries, then calculate ratios last (figure labels in Korean)
Follow along: building an SQL ad performance report query
There are two tables (sample data). ads.ad_spend holds ad cost and clicks by date and channel, and shop.orders is an orders table that records which channel each order came from. Order 5 came in through organic search, not an ad. This example assumes each order is assigned to exactly one channel.
ad_spend (ad cost)
| spend_date | channel | clicks | cost |
|---|---|---|---|
| 2026-11-02 | Search ads | 120 | 30000 |
| 2026-11-02 | Social | 200 | 20000 |
| 2026-11-03 | Search ads | 100 | 25000 |
| 2026-11-03 | Social | 180 | 18000 |
| 2026-11-04 | Search ads | 80 | 20000 |
| 2026-11-04 | 50 | 5000 |
orders
| order_id | order_date | channel | amount |
|---|---|---|---|
| 1 | 2026-11-02 | Search ads | 30000 |
| 2 | 2026-11-02 | Social | 15000 |
| 3 | 2026-11-03 | Search ads | 45000 |
| 4 | 2026-11-03 | Social | 12000 |
| 5 | 2026-11-03 | Organic | 20000 |
| 6 | 2026-11-04 | Search ads | 30000 |
| 7 | 2026-11-04 | 25000 | |
| 8 | 2026-11-04 | Social | 9000 |
1. Summarize the ad spend table by channel: Use GROUP BY from part 9 to reduce multiple rows per date to one row per channel.
SELECT channel, SUM(clicks) AS clicks, SUM(cost) AS cost
FROM ads.ad_spend
GROUP BY channel
ORDER BY cost DESC;| channel | clicks | cost |
|---|---|---|
| Search ads | 300 | 75000 |
| Social | 380 | 38000 |
| 50 | 5000 |
Search ads cost 30,000 + 25,000 + 20,000 = 75,000 won, with 120 + 100 + 80 = 300 clicks. The three channels add up to 118,000 won, the same as the original table's total, and we'll use this number again for the final check.
2. Summarize the orders table by channel: In this example, one order counts as one conversion.
SELECT channel, COUNT(*) AS conversions, SUM(amount) AS revenue
FROM shop.orders
GROUP BY channel
ORDER BY revenue DESC;| channel | conversions | revenue |
|---|---|---|
| Search ads | 3 | 105000 |
| Social | 3 | 36000 |
| 1 | 25000 | |
| Organic | 1 | 20000 |
Search ads has orders 1, 3 and 6, so 3 conversions and 105,000 won, and the four channels add up to 186,000 won. Notice there's an Organic row here that wasn't in the ad spend table.
3. Join the two summaries with WITH and LEFT JOIN to get ROAS: Name queries 1 and 2 and lift them into WITH as in part 11, then use the LEFT JOIN from part 10 to attach ad cost to the order summary as the base.
WITH cost_by_ch AS (
  SELECT channel, SUM(clicks) AS clicks, SUM(cost) AS cost
  FROM ads.ad_spend
  GROUP BY channel
),
sales_by_ch AS (
  SELECT channel, COUNT(*) AS conversions, SUM(amount) AS revenue
  FROM shop.orders
  GROUP BY channel
)
SELECT s.channel, c.cost, s.conversions, s.revenue,
  ROUND(SAFE_DIVIDE(s.revenue, c.cost) * 100, 1) AS roas_pct
FROM sales_by_ch AS s
LEFT JOIN cost_by_ch AS c ON s.channel = c.channel
ORDER BY s.revenue DESC;| channel | cost | conversions | revenue | roas_pct |
|---|---|---|---|---|
| Search ads | 75000 | 3 | 105000 | 140.0 |
| Social | 38000 | 3 | 36000 | 94.7 |
| 5000 | 1 | 25000 | 500.0 | |
| Organic | NULL | 1 | 20000 | NULL |
Search ads ROAS is 105,000 ÷ 75,000 × 100 = 140.0, and Social is 36,000 ÷ 38,000 × 100 = 94.73…, rounded to one decimal place as 94.7. Organic has no match in the ad spend table, so, as the LEFT JOIN description in the query syntax docs says, cost, a column from the right table, is filled with NULL.
The new functions are SAFE_DIVIDE and ROUND. According to the mathematical functions docs, SAFE_DIVIDE is equivalent to division (X / Y) but returns NULL if an error occurs, such as division by zero. The same docs say mathematical functions return NULL if any input is NULL, which is why Organic's ROAS is NULL too. Dividing INT64 by INT64 still returns FLOAT64, so you get a decimal point as in 140.0, and ROUND(value, 1) keeps one decimal place and rounds halfway cases away from zero.
4. CPA and conversion rate from the same summaries: If you only want to see ad channels, use the ad spend summary as the base this time. Below, the two WITH entries from query 3 stay as they are and only the main query changes.
-- the WITH cost_by_ch, sales_by_ch part is the same as query 3
SELECT c.channel, c.clicks, c.cost, s.conversions,
  ROUND(SAFE_DIVIDE(s.conversions, c.clicks) * 100, 2) AS cvr_pct,
  ROUND(SAFE_DIVIDE(c.cost, s.conversions)) AS cpa
FROM cost_by_ch AS c
LEFT JOIN sales_by_ch AS s ON c.channel = s.channel
ORDER BY cpa;| channel | clicks | cost | conversions | cvr_pct | cpa |
|---|---|---|---|---|---|
| 50 | 5000 | 1 | 2.0 | 5000.0 | |
| Social | 380 | 38000 | 3 | 0.79 | 12667.0 |
| Search ads | 300 | 75000 | 3 | 1.0 | 25000.0 |
Social's conversion rate is 3 ÷ 380 × 100 = 0.789…, so 0.79, and CPA is 38,000 ÷ 3 = 12,666.6…, rounded to the nearest integer as 12,667. Switching the base to the ad spend summary dropped the Organic row: which table you put on the left decides which rows stay in the report, exactly the use of LEFT JOIN we learned in part 10. All result values were calculated by hand, since the sample tables are small enough to count.
Where does everything we've learned show up in this query?
Most of the series fits into query 3. Here's where each part was used, side by side.
| Part | What we learned | Where it's used in query 3 |
|---|---|---|
| Parts 1 and 2 | Table structure, tables linked by keys | channel, the shared column that links the two tables like a key |
| Part 4 | Data types and NULL | INT64 division returns FLOAT64, Organic's NULL ad cost |
| Part 5 | Logical execution order of a query | Summarizing inside WITH in FROM → GROUP BY → SELECT order |
| Part 6 | SELECT, AS, calculated columns | Calculated columns and aliases like roas_pct |
| Part 8 | ORDER BY | Sorting channels from highest revenue |
| Part 9 | GROUP BY, SUM, COUNT | Cost, clicks, conversions and revenue by channel |
| Part 10 | LEFT JOIN, ON | Attaching the ad spend summary to the order summary |
| Part 11 | WITH (CTE) | The two steps cost_by_ch and sales_by_ch |
Normalization from part 3 isn't directly visible, but it's the very reason ad spend and orders live in separate tables in the first place. Ad spend has one row per date and channel and orders have one row per order, so we're joining tables where a row means a different unit, which is why steps 1 and 2, bringing both to the channel level before joining, were needed.
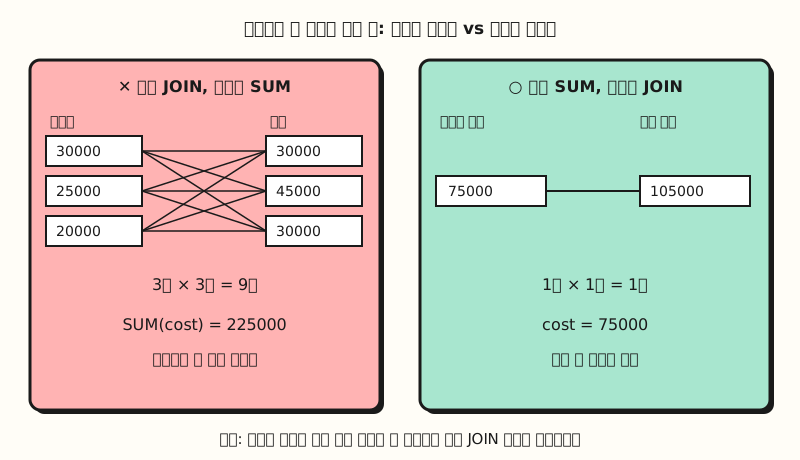 Concept figure: joining tables of different units first multiplies rows and inflates totals; summarizing first means single rows meet (figure labels in Korean)
How would you use this at work? Steps for a weekly ad report
Let's say you report ad performance by channel every Monday. Rather than writing the query right away, following the steps below makes it easier to find where a number went wrong if it does.
- Turn the question into metrics: Write "how much did we spend and earn per channel" as four columns, cost, conversions, revenue and ROAS, and mark which table each metric's numerator and denominator come from.
- Summarize each table at the same unit: If the reporting unit is channel, reduce both tables with
GROUP BY channelfirst. When filtering by period, put the same period condition in each table inside WITH, likeWHERE spend_date BETWEEN ...from part 7. - Pick a base table and join: To see every channel that produced revenue, put the order summary on the left; to see only channels you spent money on, put the ad spend summary on the left, then LEFT JOIN.
- Calculate ratios last: Write every division whose denominator could be 0 or NULL with SAFE_DIVIDE.
- Check the totals: See whether the result's total cost matches the original ad spend table total (118,000 won in the example) and total revenue matches the orders table total (186,000 won). If a number came out larger, suspect step 3, not step 4.
In this example, each order's channel was already written in the table as a single value, but in practice the same order can land in a different channel depending on the rule for which channel gets credit. No matter how precisely you write the query, ROAS changes if that rule changes, so I'd recommend noting it in the report.
Practice problems
1. (Easy) Using only the ad spend table, calculate cost per click (ad cost ÷ clicks) by channel. Round to an integer.
Show answer
SELECT channel,
  ROUND(SAFE_DIVIDE(SUM(cost), SUM(clicks))) AS cpc
FROM ads.ad_spend
GROUP BY channel
ORDER BY cpc DESC;
Search ads 250.0 (75,000 ÷ 300), Social 100.0 (38,000 ÷ 380), Email 100.0 (5,000 ÷ 50). Social and Email have the same value, so sorting by cpc alone doesn't guarantee their order. To fix the order, add another column, like ORDER BY cpc DESC, channel.
2. (Medium) Keeping the two WITH entries from query 3, calculate ad cost, revenue and ROAS for all ad channels combined into one row.
Show answer
-- the WITH cost_by_ch, sales_by_ch part is the same as query 3
SELECT SUM(c.cost) AS cost, SUM(s.revenue) AS revenue,
  ROUND(SAFE_DIVIDE(SUM(s.revenue), SUM(c.cost)) * 100, 1) AS roas_pct
FROM cost_by_ch AS c
INNER JOIN sales_by_ch AS s ON c.channel = s.channel;
You get 118,000 won, 166,000 won, 140.7. Because it's an INNER JOIN, Organic's 20,000 won with no ad cost drops out (186,000 − 20,000 = 166,000), and 166,000 ÷ 118,000 × 100 = 140.67….
3. (Medium) Calculate ad cost, ad-channel revenue (excluding Organic) and ROAS by date.
Show answer
WITH daily_cost AS (
  SELECT spend_date, SUM(cost) AS cost
  FROM ads.ad_spend GROUP BY spend_date
),
daily_sales AS (
  SELECT order_date, SUM(amount) AS revenue
  FROM shop.orders
  WHERE channel != 'Organic'
  GROUP BY order_date
)
SELECT c.spend_date, c.cost, s.revenue,
  ROUND(SAFE_DIVIDE(s.revenue, c.cost) * 100, 1) AS roas_pct
FROM daily_cost AS c
LEFT JOIN daily_sales AS s ON c.spend_date = s.order_date
ORDER BY c.spend_date;| spend_date | cost | revenue | roas_pct |
|---|---|---|---|
| 2026-11-02 | 50000 | 45000 | 90.0 |
| 2026-11-03 | 43000 | 57000 | 132.6 |
| 2026-11-04 | 25000 | 64000 | 256.0 |
On November 3, orders 3 and 4 total 57,000 won, divided by 43,000 won in ad cost gives 132.55…, so 132.6. Only the reporting unit changed from channel to date; the order of summarizing each table and then joining stays the same.
Common mistakes
- Joining tables first and summing later: If you join
ads.ad_spendandshop.ordersdirectly onchanneland then GROUP BY, Search ads' 3 cost rows meet its 3 order rows to make 9 rows, and total ad cost comes out as 225,000 won instead of 75,000. The query syntax docs describe INNER JOIN as taking every combination (the Cartesian product) of the two tables and discarding rows that don't meet the condition, so when a row has several matches, rows multiply by that many. Stick to summarize, then join as in the figure above, and confirm with a total check. - Dividing with
/and having the query stop at zero: According to the operators docs, dividing by zero returns an error, and the docs point to SAFE_DIVIDE or IEEE_DIVIDE for that case. If some day a channel has 0 conversions, the whole query fails at the CPA calculation (ad cost ÷ conversions), so it's safer to write divisions in report queries with SAFE_DIVIDE from the start. Other DBMSs avoid it differently: the PostgreSQL conditional functions docs give an example of avoiding a division-by-zero failure with CASE WHEN, and you can also useNULLIF(denominator, 0)from the same docs to turn 0 into NULL before dividing. - Averaging per-channel ROAS with AVG: Averaging 140.0, 94.7 and 500.0 from query 3 gives 244.9, but the combined ad-channel ROAS from practice problem 2 is 140.7. That's because Email with 5,000 won in ad cost and Search ads with 75,000 won get mixed with equal weight; an overall ratio needs the numerators and denominators summed separately, then divided again.
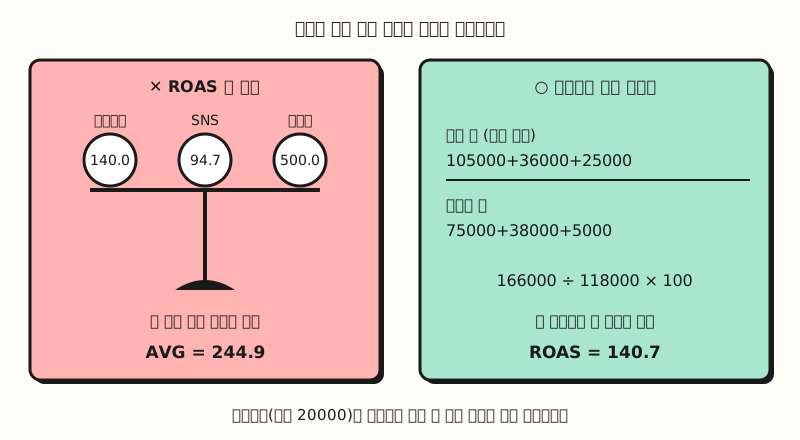 Concept figure: an average of ratios ignores the size of ad spend, so it differs from dividing the totals (figure labels in Korean)
Wrapping up
An SQL ad performance report query comes down to three steps: summarize each table at the same unit first, pick a base table and attach with LEFT JOIN, then calculate ratios last with SAFE_DIVIDE. If a number looks off, I'd recommend starting with a check against the original tables' totals. Thank you for following the series all the way from part 0, "What is a database?", to part 12. I wrote these posts while learning myself, so if I find anything that changes as I apply this to real data, I'll share it again. For each part, please refer to the full curriculum. This post ends the SQL Basics series and there's no next part, so if any syntax gets confusing, go back to that part and follow along with the sample tables again.
FAQ
- How do I calculate ROAS in SQL?
- Divide total revenue by total ad cost and multiply by 100. In BigQuery you write it like ROUND(SAFE_DIVIDE(revenue, cost) * 100, 1), but don't join the ad spend table and the orders table directly; total each by channel first and then join them so the totals don't inflate.
- What's the difference between SAFE_DIVIDE and / division?
- The result is the same, but / returns an error and stops the query when dividing by zero, while SAFE_DIVIDE returns NULL in that spot. If an input is NULL, both return NULL.
- My total ad cost got bigger after a JOIN. Why?
- When you join two tables where a row means a different unit as they are, a row with several matches is multiplied by that many. If you first GROUP BY both tables at the same unit, such as channel or date, and then JOIN, single rows meet and the totals match.
Related posts
- SQL Subqueries and WITH (CTE): Breaking Up Long Queries - SQL Basics part 11, the WITH that split the report query into steps
- SQL JOIN Explained: INNER JOIN vs LEFT JOIN with Examples - SQL Basics part 10, the LEFT JOIN that attached the summaries
- Ad metrics basics: how to calculate CPC, CPM, CTR, conversion rate and ROAS - what the ROAS and CPA calculated by the query mean